
Workflow Enhancing Digital Audio Workstation
Unbridled creativity and improved workflow starts here.
Student? Send a valid ID to get a 30% EDU discount on Lifetime Licenses.
Free 10-Track DAW
$0.00
Login or create an account to access our free trials.
Everything Bundle
$9.99 / Month
Save $20/year.
Please login or sign up to make a purchase.
Lifetime License
$200.00 for Life
Please login or sign up to make a purchase.
Beat Bashing Drum Machine
Create full and complex drums that sound inspired.
Student? Send a valid ID to get a 30% EDU discount on Lifetime Licenses.
Free Trial
$0.00
Login or create an account to access our free trials.
Everything Bundle
$9.99 / Month
Save $20/year.
Please login or sign up to make a purchase.
Lifetime License
$150.00 for Life
Please login or sign up to make a purchase.
Note Juggling Arpeggiator
Automate the creation of beautiful melodies and motifs.
Student? Send a valid ID to get a 30% EDU discount on Lifetime Licenses.
Free Trial
$0.00
Login or create an account to access our free trials.
Everything Bundle
$9.99 / Month
Save $20/year.
Please login or sign up to make a purchase.
Lifetime License
$100.00 for Life
Please login or sign up to make a purchase.
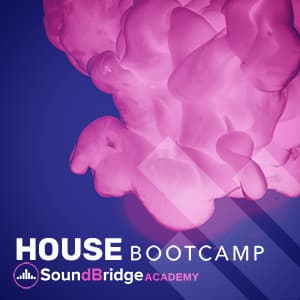
Produce Professional House Music
Are you ready to master House music?
Lifetime License
$64.99 for Life
Please login or sign up to make a purchase.

Produce Professional Trap Music
Are you ready to master Trap music?
Lifetime License
$64.99 for Life
Please login or sign up to make a purchase.
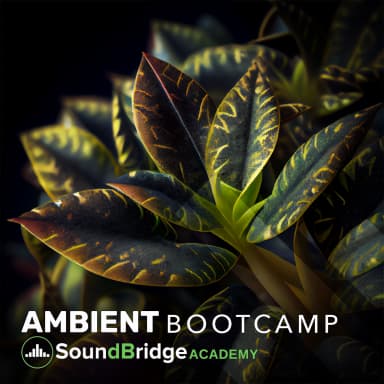
Produce Professional Ambient Music
Are you ready to master Ambient music?
Lifetime License
$64.99 for Life
Please login or sign up to make a purchase.
Add Another Production Computer
Need another computer activation?
Computer Activation
$49.99 for Life
Please login or sign up to make a purchase.
Renew Your Upgrade Eligibility
Our upgrades often contain new features and functionality, not just bug fixes.
Upgrade Eligibility Renewal
$79.99 / 2-Years
Please login or sign up to make a purchase.